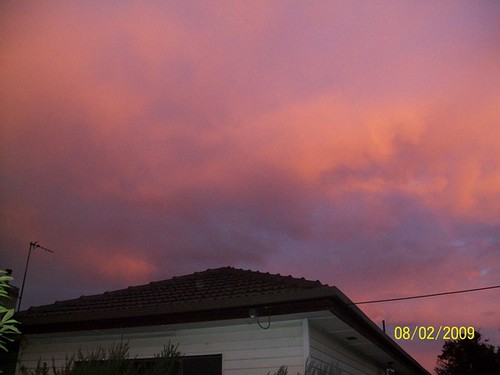
Last night in Australia, one of the states developed a series of bush fires that have ravaged communities – survivors describe it as “raining fire” that came out of no where. As I write this, up to 76 people have been killed.

The sky is said by Dave Hollis to look how it is in the movie ‘Independence Day’
An important lesson has come out out of this. First, the good stuff.
Googler Pamela Fox has created an invaluable tool to display the bush fires in real time. Using Google technologies like App engine and the Maps API (which she is the support engineer for), she’s been able to create a mashup that helps the public.
She can do so because the Victorian Fire department supports the open standard RSS. There are fires in my state of New South Wales as well, but like other Fire Department’s in Australia, there is no RSS feed to pull the data from (which is why you won’t see any data on the map from there) It appears states like NSW do support RSS for updates, but it would be more useful if there was some consistency – refer to discussion below about the standards.
For further information, you can read the Google blog post.
While the Fire Department’s RSS allows the portability of the data, it doesn’t have geocodes or a clear licence for use. That may not sound like a big deal, but the ability to contextualise a piece of information in this case matters a hell of a lot.
As a workaround, Pamela sent addresses through the Google geocoder to develop a database of addresses with latitude and longtitude.
GeoRSS and KML
In the geo standards world, two dominant standards exist that enable the portability of data. One is an extension to RSS (GeoRSS) that allows you to extend an RSS feed to show geodata. The other in Keyhole Markup Language, which was a standard developed by Google. GeoRSS is simply modifying RSS feeds to be more useful, while KML is more like how HTML is.
If the CFA and any other websites had supported them either of these standards, it would have made life a lot more easier. Pamela has access to Google resources to translate the information into a geocode and even she had trouble. (Geocoding the location data was the most time-consuming of the map-making process.)
The lessons
1) If you output data, output it in some standard structured format (like RSS, KML, etc).
2) If you want that data to be useful for visualisation, include both time and geographic (latitude/longitude information). Otherwise you’re hindering the public’s ability to use it.
3) Let the public use your data. The Google team spent some time to ensure they were not violating anything by using this data. Websites should be clearer about their rights of usage to enable mashers to work without fear
4) Extend the standards. It would have helped a lot of the CFA site extended their RSS with some custom elements (in their own namespace), for the structured data about the fires. Like for example <cfa:State>Get the hell out of here</cfa>.
5) Having all the Fire Department’s using the same standards would have make a world of difference – build the mashup using one method and it can be immediately useful for future uses.
Pamela tells me that this is the fifth natural disaster she’s dealt with. Every time there’s been an issue of where to get the data and how to syndicate it. Data portability matters most for natural disasters- people don’t have time to deal with scraping HTML (didn’t we learn this with Katrina?).
Let’s be prepared for the next time an unpredictable crisis like this occurs.
